Census Report 001
The Echo Audit
Abstract. We registered 71 famous Bitcoin indicators - formulas and public data sources fixed in advance - and built point-in-time weekly signals for the 32 with sufficient usable history. Then we measured every pairwise relationship and stratified the evidence by durability: a correlation only counts as confirmed if it held at |rho| ≥ 0.85 across at least four years AND in both halves of the window independently. The result: twelve of the most famous “valuation indicators” collapse into a single confirmed echo chamber - one measurement wearing twelve costumes - while the genuinely independent signals are largely the macro and flow forces most dashboards ignore. Eight indicators formally inherit verdicts from instruments that already faced trial. Every number regenerates from public data.
Why we counted
Open any Bitcoin dashboard and you face forty gauges. MVRV, NUPL, Mayer Multiple, the rainbow, the 2-year MA bands, top cap, delta cap - each presented as an independent expert opinion. When most of them agree, it feels like overwhelming evidence.
But agreement is only evidence if the gauges are independent. If they are arithmetic re-arrangements of each other, forty agreeing gauges are one opinion shouted forty times. Nobody had measured which is which - with fixed formulas, no lookahead, and thresholds chosen before the results were known. So we did.
The method, in plain language
- Register first. Every indicator entered a public registry - exact formula, named public data source - before any screening ran. No indicator can be quietly redefined after the fact.
- No lookahead, anywhere. Every signal is computed point-in-time: at each date, only data available on that date. Published forms that peek at the future (full-history z-scores, retro-fitted bands) were rebuilt in their honest expanding-window form.
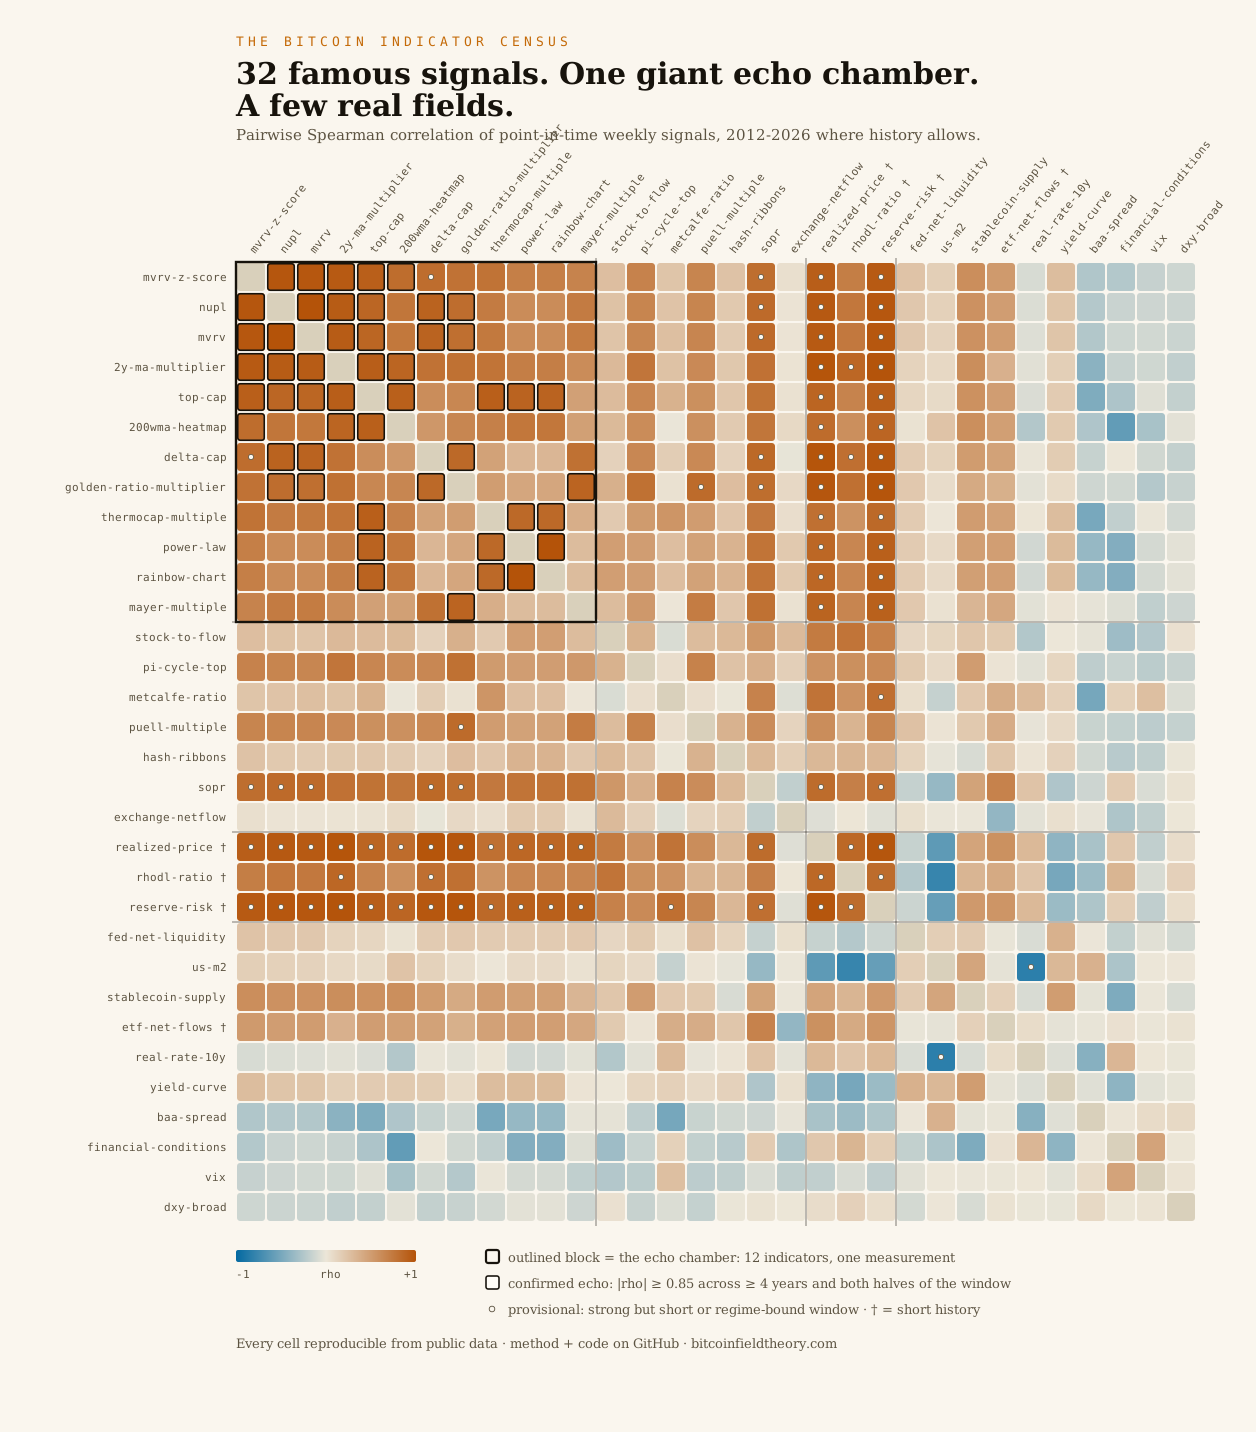
- Rank correlation, weekly, maximum shared history. Spearman rho on 32 signals - 496 pairs.
- Evidence tiers. Our own first run taught us this the hard way: within a single market regime, almost everything correlates. Short-history indicators were bridging clusters they had no durable relationship with. So the method now distinguishes confirmed relationships (≥ 4 years, threshold held in both halves of the window) from provisional ones (strong but regime-bound - reported, never chained). The revision is public, like everything else.
Finding one: the echo chamber
Twelve famous indicators - MVRV Z-Score, NUPL, MVRV, the 2-Year MA Multiplier, Top Cap, the 200-Week MA Heatmap, Delta Cap, the Golden Ratio Multiplier, Thermocap Multiple, the Power Law, the Rainbow Chart, and the Mayer Multiple - form one confirmed cluster. At the signal level, they are largely one measurement.
Three pairs deserve to be famous for the right reasons:
- Rainbow Chart ~ Power Law: rho = +1.000. Exactly. The rainbow is a log regression wearing stripes. This is by construction, and now it is also by measurement.
- NUPL = 1 - 1/MVRV. An algebraic identity. Ranked against each other they are the same number (+0.998 in our weekly signals). Every dashboard displaying both as separate gauges is displaying one measurement twice.
- 2-Year MA Multiplier ~ MVRV Z-Score: +0.963. This is the quiet scandal. The celebrated on-chain metric - realized cap, blockchain forensics, cost-basis analysis - is 96 percent rank-identical to dividing price by its own two-year moving average. Over fourteen years, the on-chain data adds almost nothing to the signal.
Finding two: eight formal echoes
Because two of the cluster’s instruments have already faced full pre-registered trials (MVRV Z-Score and NUPL, both rejected) and one is the admitted primary (the Power Law), the census can assign inherited verdicts: an indicator that tracks a tested instrument at confirmed tier is an echo - not independent evidence. Eight indicators now carry formal echo status on the living Census, including the Rainbow Chart (echo of the Power Law) and a chain of cost-basis variants (echoes of the rejected MVRV/NUPL). An echo of a rejected measurement is a stronger statement than a rejection - it means the indicator was double-counted and the thing it double-counts failed its trial.
Finding three: the real fields are elsewhere
The genuinely independent signals - no confirmed relationship to the echo chamber or to each other - are mostly the ones chart culture ignores: Fed net liquidity, US M2 growth, real 10-year rates, the broad dollar, the yield curve, credit spreads, financial conditions, the VIX, stablecoin supply growth, and ETF flows - all ten distinct at the confirmed threshold. So are a handful of on-chain constructs: Stock-to-Flow, Pi Cycle, the Metcalfe ratio, miner economics, SOPR, exchange netflow.
Independence is not endorsement. A distinct signal can still be a distinct noise - Stock-to-Flow is independent here precisely because it fails differently. Which signals carry real information is what admission trials decide, one pre-registered verdict at a time. But the map settles the prior question: if you want more evidence, you will not find it by adding a thirteenth gauge to the echo chamber.
What we refused to conclude
- Four indicators (Realized Price, RHODL, Reserve Risk, ETF flows as a signal) have only a few years of usable history. Within that window they correlate strongly with nearly everything - because within one regime, everything does. Their status is insufficient history, not echo and not independent. We will not classify them on one regime of data.
- Two registered indicators (X/Twitter sentiment, app-store rankings) have no reproducible public source. They are marked untestable rather than quietly omitted. “We cannot test this honestly yet” is a finding.
Reproduce it
Sources: CoinMetrics Community API, bitcoin-data.com, FRED (keyless CSV), DeFiLlama, Farside. The registry, the point-in-time signal construction, the tier thresholds, and the clustering code are in the public repository, and the frozen snapshots carry SHA-256 hashes. The map itself lives at bitcoinfieldtheory.com/indicators and updates as trials complete. If you find an error, we want it public.
What happens next
The census is the map, not the verdicts. The trial queue works through the independents - Stock-to-Flow is next - and every verdict updates the living page. Echoes can petition for their own trial by demonstrating decorrelation. The goal is the smallest set of independent evidence that explains Bitcoin’s value. The map says that set is small. The trials will say what belongs in it.